Get to know Datalytics, Health Prime's RCM and analysis platform that will let you focus on your metrics to determine areas of improvement on your medical practice and monitor its overall health.
On our webinar "Datalytics: The RCM platform you need to know about", Health Prime's Business Process Analyst, Karin Johnson, gave an overview about Datalytics, our analysis platform that will let you get an insight of your medical practice and gain transparency into your medical billing collections process.
By having an insight on your analytics, you will be able to look for areas of improvement that will help you upgrade your medical practice management and obtain the maximum reimbursement possible.
Health Prime's Datalytics focus on insights that other medical
billing business intelligence solutions neglect
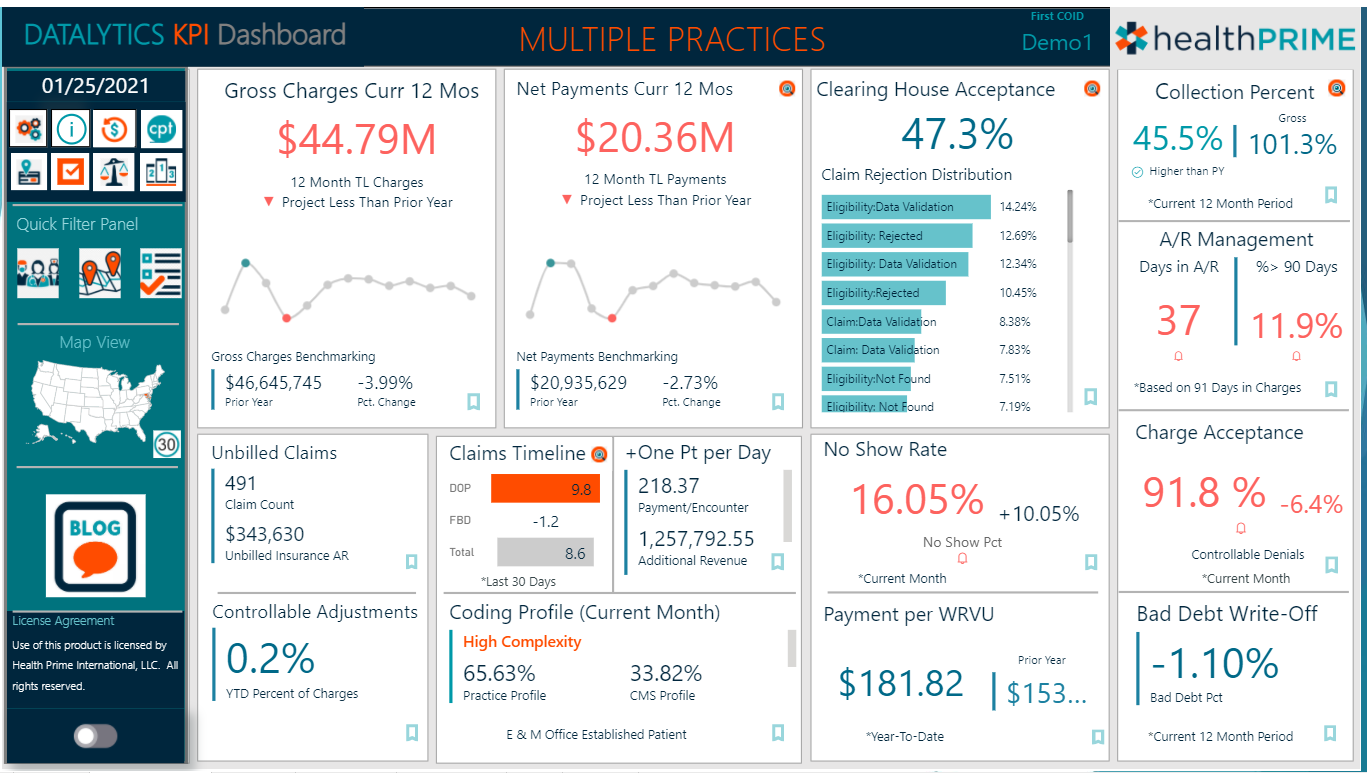
With Datalytics you will be able to see your Key Performance Indicators (KPI's) to track how you are doing, determine if your targets are being met and how better or worse your practice is compared to last year.
Datalytics Raises the Bar for Medical Billing Analysis. With its predictive modeling, Datalytics provides awareness of what your medical practice future holds. By drilling down into details you can understand the story behind your numbers and have that decision support from data to make process improvement modifications in your medical practice.

Once you logged into the platform, the Dashboard of your practice is display providing a glance view of every KPI of your practice. Each KPI includes an information icon that provides a brief definition of it as well as a bookmark icon that provides access to additional details. The data is display for all providers, service locations and specialties of the practice. This information can be filtered depending on what you want to see.
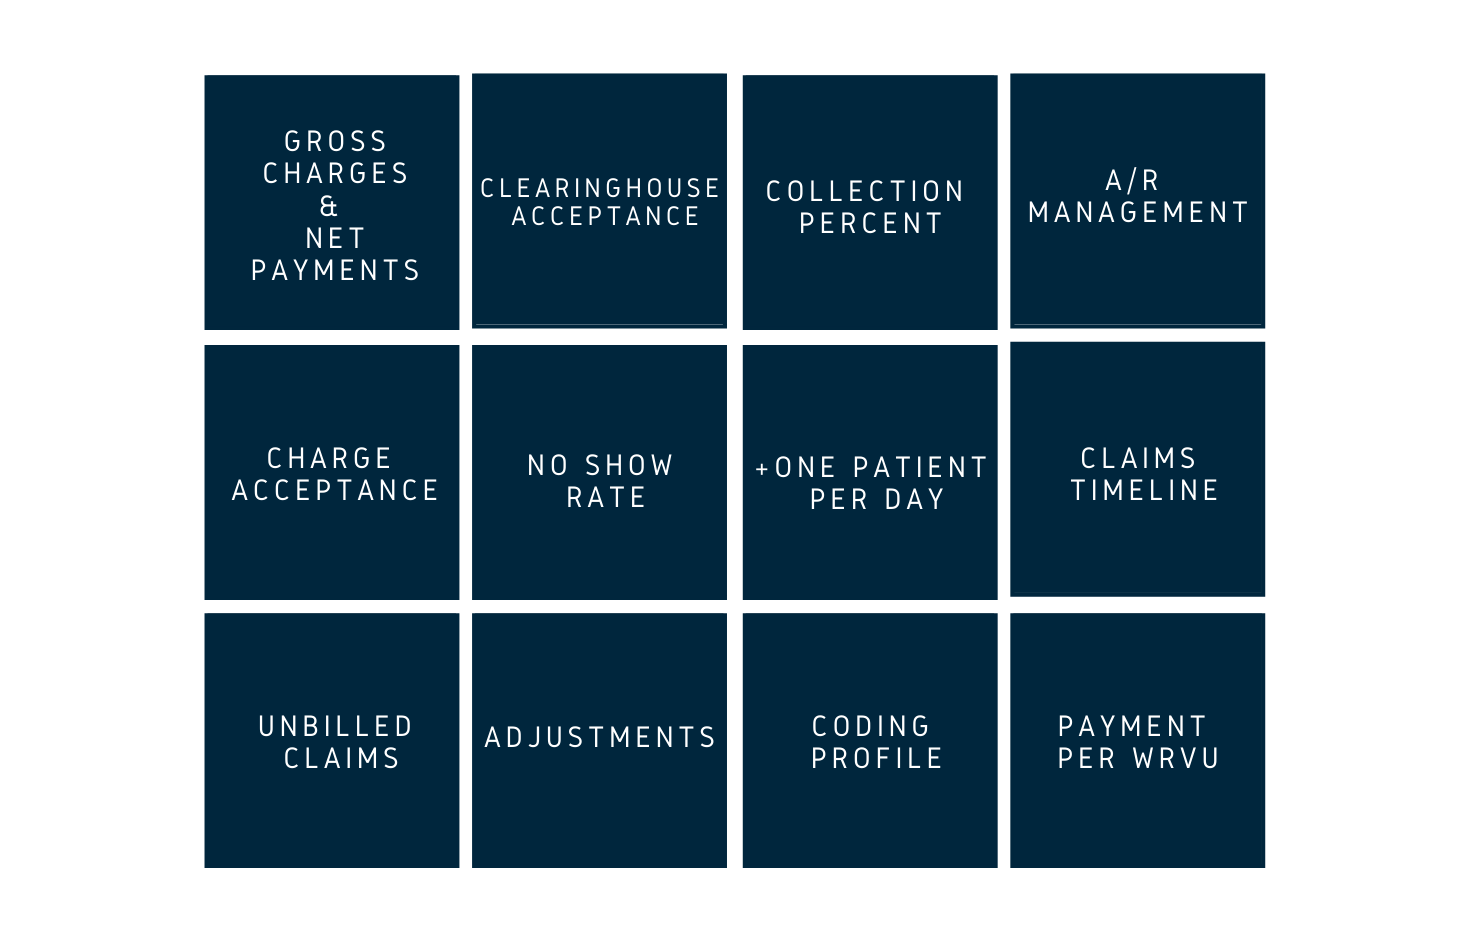
What KPI's can you monitor using Datalytics?

1. Gross Charges and Net Payments
Datalytics provides the ability to look at this metric in a different manner.
In terms of Gross Charges, you will see the year over year comparison of charges and a projection for the current year based on the average monthly charges and the variance from the previous year. Gross Charges are presented in a year by month view, as a Payer mix and by provider. Net Collections are presented with these last 3 features, also including Payment Type and Payment Place.
2. Clearinghouse Acceptance
Percentage of claims year to date that made it to the clearinghouse on first pass. Datalytics offers a "Claim Rejection Category Distribution" detail that will give you a claim rejection detail analysis to get to the root cause of rejection so you can identify it and work on it to improve your processes.
3. Collection Percent
Percentage of charges converted to payments in the current 12 months. This metric is good for forecasting. Datalytics also has a Financial Class Payment to Charge Ratio Performance report that provides a breakdown by year and financial class of the PCR, as well as the overall average.
4. A/R Management
For Accounts Receivable, you can analyze 2 key metrics in the dashboard: Days in AR and the percent of primary insurance over 90 days from the first billed date.

Industry objective for this metric is less than 50 days. Health Prime's best practice is 28 days for Total AR (20 days for Primary Insurance, 2 days for all additional insurance and 6 days for patient). In the AR detail tab, you can see more information such as: Total AR, Insurance AR and Patient AR. On Datalytics, you will be able to see the breakdown by Financial Class, aging buckets, or even claim level.
5. Charge Acceptance
Percentage of charges that are paid on first pass to the payer without being denied for controllable reasons. Health Prime's best practices is 98%. On this KPI you can also see your denial rate by percentage allowing you to quantify the effectiveness of your RCM processes. Industry average is 5-10%, however HP best practice is <2%.

You can export your own data and analyze the denial detail to develop performance improvement plans to reduce or eliminate denial or group of denials.
Health Prime's benchmarks are above the industry average
so you can monitor your medical practice focusing on best practices.
6. No Show Rate
Percentage of expected appointments that were No Show by the patient for the current month. Only available if the Appointment Scheduler is used in the PM system. Cancellations and Rescheduled appointments are not included in this KPI calculation. Health Prime's target for No Show is 6% or below.
Datalytics offers a breakdown by Appointment type to get a better understanding of where the No Shows are coming from. You will also have access to a trending graph that provides the percent and dollar amount for No Show appointments by month.
7. +One Patient per Day
Value-added feature not normally captured on your typical billing company dashboard.

With this Datalytics feature you can also access to the procedure code summary breakdown that provides the units, charges, payments, adjustments, payment per unit, charge mix breakdown and per unit payment by financial class.
8. Claims Timeline
Average number of days between Date of Service, Date of Posting and First Billed Date for the last 30 days. How does it work?
- Number of days from Date of Service to Date of Posting: how long it takes for the provider to send the charges.
- Number of days from Date of Posting to First Billed Date: time it takes the biller to submit the claim to insurance.
With Datalytics you can see the timeline for each provider in the practice. This enables practice managers to be aware into where delays in claim submission may lie.
9. Unbilled Claims
This KPI shows the number and dollar amount of those claims in an unbilled status. You can get detailed breakdowns of this KPI by patient ID, encounters and procedure department. Also, you can drilldown into the encounters to view any notes pertaining to the reason for the unbilled status.
Which claims are included?
- Claims in queue daily for claims submission.
- Claims that are on hold awaiting answers to billing tasks.
- Claims that have failed pre-bill edits.
- Claims that have been rejected by the clearinghouse.
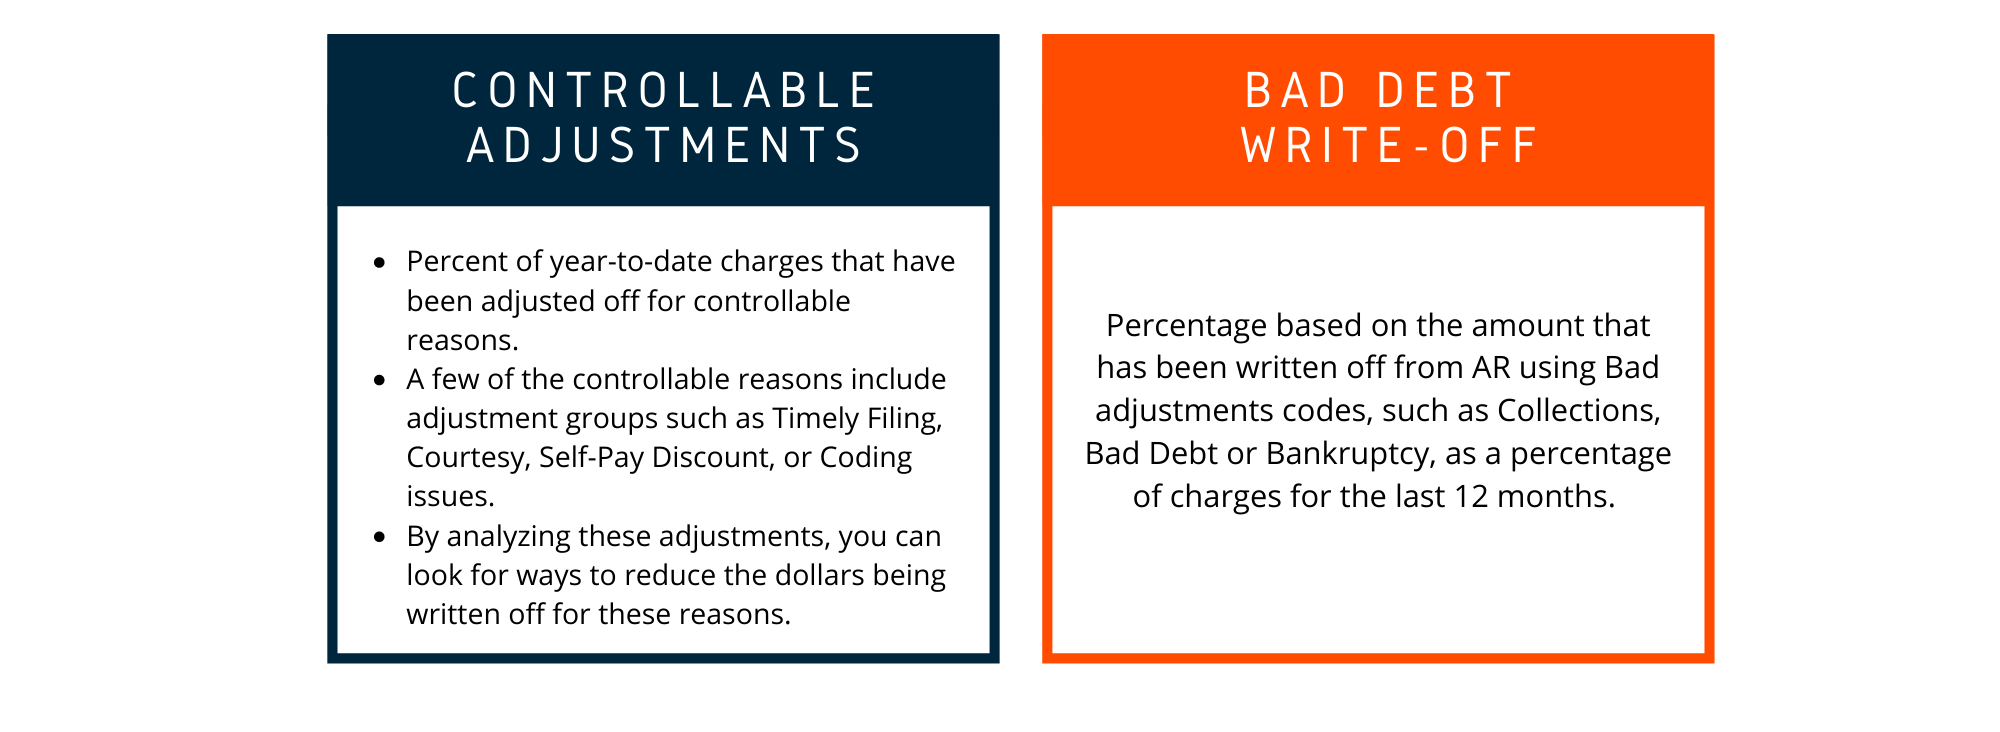
10. Adjustments
There are 2 types of Adjustments cards:

11. Coding Profile
Datalytics offers a Coding Profile of your practice for information purposes.
It provides practices the visibility for looking at how their office bills high complexity E/M visits compared to the CMS profile for the same specialty. You will be able to determine if your practice is a high profile of low-profile coder.
12. Payment per WRVU
Total payments received year to date divided by the year-to-date work RVUs. Providing the WRVU detail allows practices to compare the measure of work performed from one year to the next as well as comparing one provider against another.
If you want more information about Datalytics and how you can improve your medical practice by using it, set up a 1 on 1 training with your Health Prime's Operations Consultant. If you are not a client yet, feel free to email us any question you may have at marketing@hpiinc.com. Set up a meeting with us to discuss how Health Prime can help you get your practice back in its Prime.
Subscribe to our Datalytics blog for future articles to find out about software updates, new features and how our analytics platform has had a tremendous impact in physician practice revenue cycle management.


/jpg_people%20working%20on%20analytics%20data%20on%20KPI%20dashboard-metrics_4229x2819.jpeg)


-3.png)
-3.png?width=380&name=health-prime-logo5%20(002)-3.png)
Submit a Comment